Categories Description
Multidimensional analyses are often completed with unidimensional ones to characterize some particular variables.
To characterize a categorical variable and the groups of individuals its categories define, one can use continuous variables, categorical ones or also categories.
Objectives
We are going to use the dataset "tea" and characterize the "age_Q" variable.
"age_Q" is a categorical variable corresponding to age groups. Its categories are "15-24", "25-34", "35-44", "45-59" and "+60".
The main question that arises here is: are those different categories specifically linked to other variables/categories of the data set ?
Each category of "age_Q" defines a sub-population: the group of the individuals who possess the category. The use of the catdes function is going to allow us to see whether each sub-population can be characterized by the categorical variables, categories and continuous variables of the data set.
catdes
First load the package and the data set by typing:
library(FactoMineR)

data(tea)
Then launch the catdes() function:
res = catdes(tea, num.var=23, proba=0.05)
#tea: the data set used

#num.var: the indice of the variable to characterize

#proba: the significance threshold considered to characterize the category (by default 0.05)
Description by categorical variables
To evaluate the link between each category of the "age_Q" variable and other categorical variables, a chi-square test is performed. The more significant the test is, the more the considered category and categorical variable are linked.
The results of this test are in:
res$test.chi2
The categorical variable the most linked to "age_Q" is "Socio-Professional Category", then "Tea", "sugar", "work" and so on.
Description by categories
To study the link between one category of "age_Q" and another category of another categorical variable of the data set, the function compares two proportions:
- the proportion of individuals who possess the second category among those who possess the first
- the global percentage of individuals who possess the second category
The categories significantly linked to the categories of "age_Q" are in:
res$category
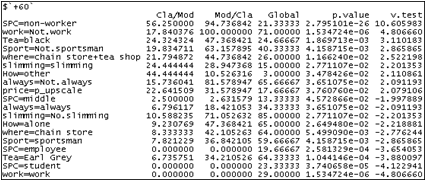
Let's have a look at two sub-populations: the groups of individuals corresponding to categories "15-24" and "+60".
The category "student" is over represented (v-test>0) among individuals aged between 15 and 24 whereas "senior" is under represented (v-test<0).
On the contrary, "senior" is over represented among individuals aged over 60 and "student" is under represented.
For the sub-population "15-24":
- 84.3% of the individuals who possess "student" possess to "15-24"
- 64.1% of the individuals who possess "15-24" possess "student"
- 23.3% of the whole population possess "student"
Description by continuous variables
For each category of "age_Q" and each continuous variable, a test value is calculated.
The results are in:
res$quanti
Here the results for categories "15-24" and "+60":
 Click to view
There is only one continuous variable in the data set: the "age" variable.
This variable is significantly linked to both "15-24" and "+60"; individuals aged between 15 and 24 are significantly younger than the whole population and those aged over 60 are significantly older.


