RcmdrPlugin for Principal Component Analysis
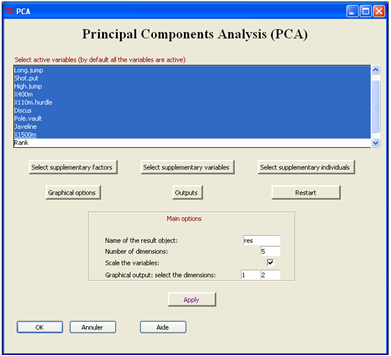
The main window allows to choose the active variables (by default all the continuous variables are active and the PCA can be done).
Several buttons allow to choose supplementary continuous or categorical variables, supplementary individuals, or to choose the outputs or the graphs to plot.
By default, a standardized PCA is performed (variables are scaled) and the plots are drawn for axes 1 and 2.
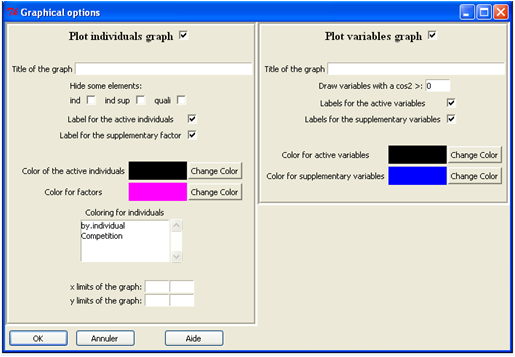
The graphical options concern the two graphs (individuals and variables). In the individuals' graph, one can choose to represent the active individuals, the supplementary individuals or colour the individuals according to the categories of the supplementary categorical variable they belong to (you have to first select the supplementary categorical variables).


